This post is part of a series focused on exploring DVS 2020 survey data to understand more about tool usage in data vis. See other posts in the series using the ToolsVis tag.
In the last post, I wrote about a weaving project that has been helping me to understand data processing in R. That’s not quite as crazy a leap as it sounds: there’s a good reason that looms were the inspiration for the first computer algorithms. For my purposes right now, the key feature of weaving is that there are stable threads (the warp threads) that are acted on in repeatable sequences (the weaving) to create a pattern. The threads themselves don’t change, but the way that they are selected (their state) varies depending on the pattern that you want to create. It turns out that this is a lot like functional programming, where a dataset (the threads) are operated on by a series of functions (the weaving) to create a desired final state.
One key insight that I discovered in weaving this project is that the fabric itself is actually a record of the sequence of those states. Not the states themselves, and not the pattern (data) of the threads. It’s only when the weft thread locks in the warp many times in a row that you end up with a pattern in your fabric. In a way, the woven pattern is a history of all of the states that the threads have gone through. The pattern is not the states themselves, but it is an index or a record of their results. Each piece of the pattern is no more than a snapshot in time, freezing one intermediate state for inclusion in the final design. I never would have seen that if I’d stayed in code. I think that’s actually what I was grasping after when my brain started thinking about music and weaving in the first place: they are both temporary patterns imposed on an underlying structure. The structure itself doesn’t actually matter in the end – a keyboard could be arranged in lots of different patterns and still play the same music – but the way those different states are combined can define an infinite variety of things.
The funny thing about insight is how opaque and impossible it feels until you see it, and how obvious it seems once you do. One of the key things I’m looking for in any exploration is that moment where all problems become one problem: where the impenetrable unknown I’m wrestling with just falls open into something that I’ve known all along. This happens all the time when my husband and I are out walking around in the woods: we take a path we’ve never tried before and we think we’re somewhere that we’ve never been, only to turn a corner and realize that we’ve just come back to the same spot that we’ve walked past a thousand times. It’s such an interesting mix of surprise and delight and confusion (how could we not have seen this before?) when you come back to a place you know from a direction that you’ve never seen.
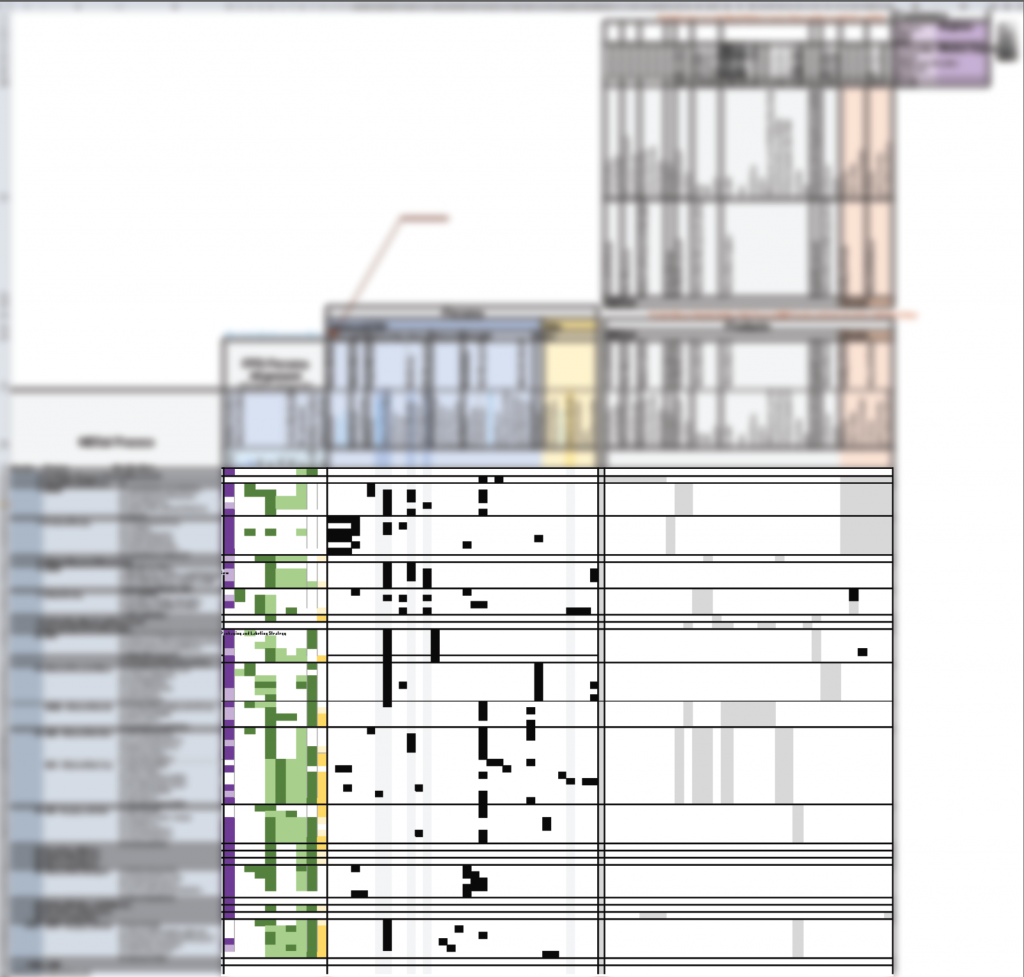
In this case, there are several problems that I’ve been working on over the past couple of years with fairly similar structures. One is a visualization of user persona, products, and the clinical trials process for work (labels intentionally blurred, for privacy’s sake). Here’s the table view of that project, which maps out the clinical trials process, a client-specific process, all of the user persona and which products they use across multiple divisions of the org, and the commercial and market segments that they relate to:

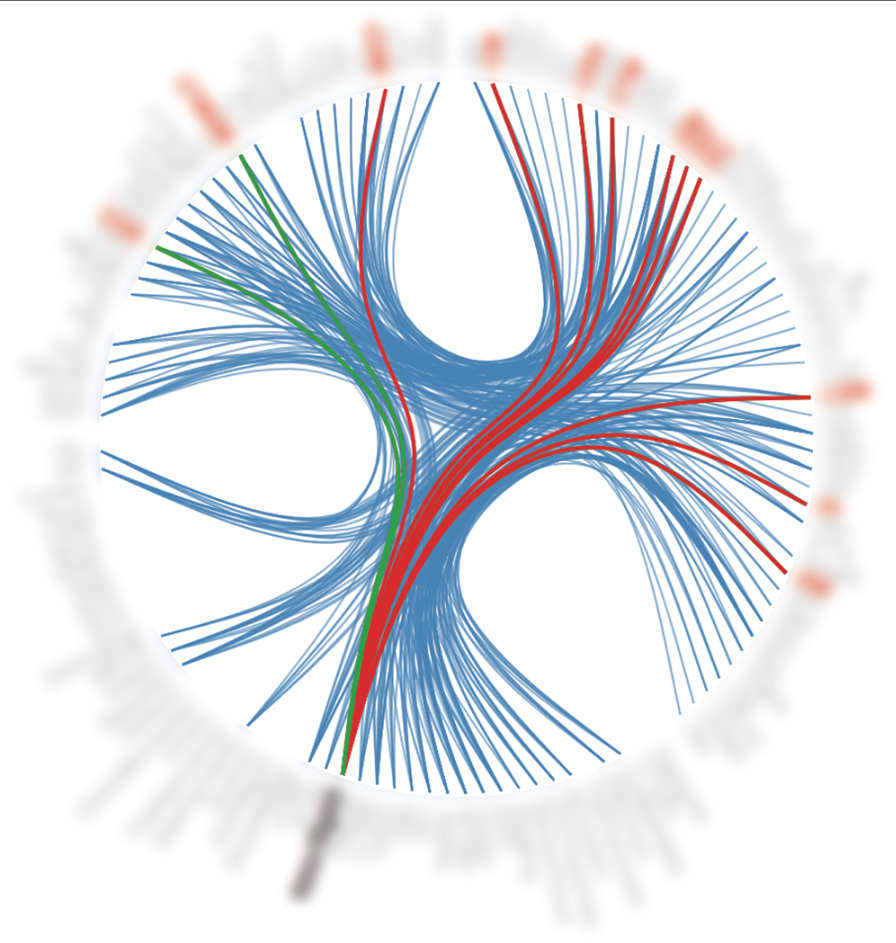
This is the same data as a network diagram, showing some of those temporary selection states, to highlight how different user persona engage with one another, and with tasks and products in each stage of the process:

Incidentally, this was the project that got me interested in learning R in the first place; the tools vis is a tangent on a tangent on a complete change of direction, and yet here I am again, back in the same place!
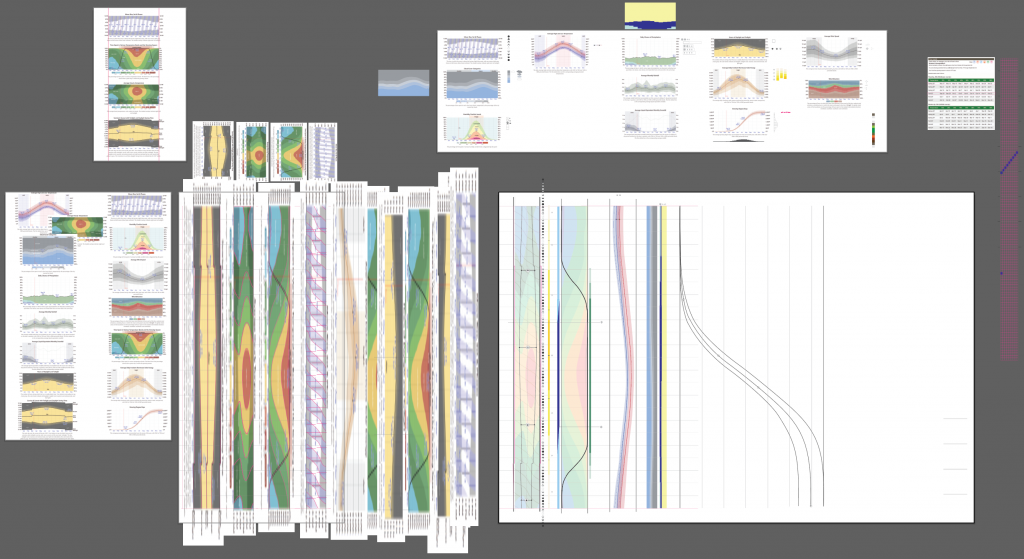
Another place where I’ve run into similar challenges is in sketching out a visualization of annual cycles to support my PlantVis side project:

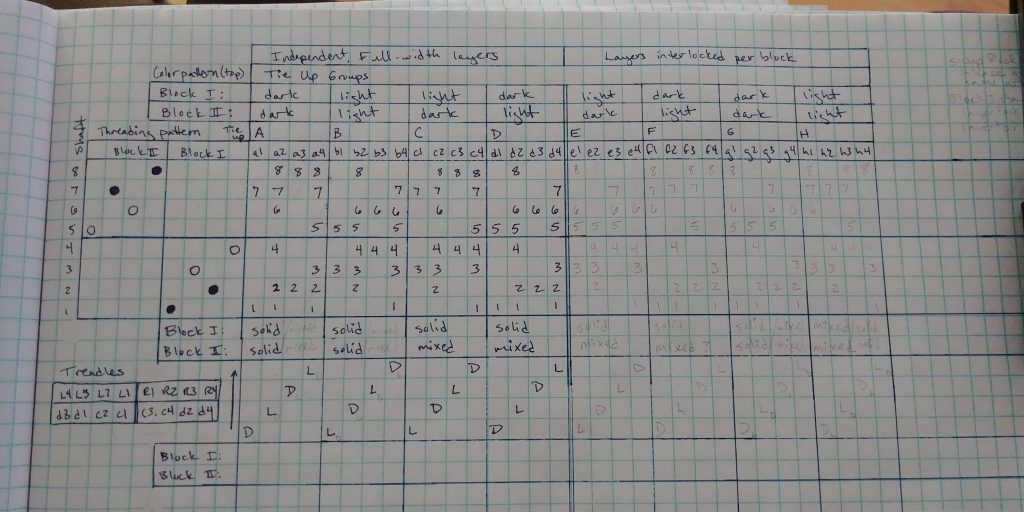
And now that I recognize it, a third was this weaving project that’s been sitting on the sidelines forever and a day.

None of these are the same problem, exactly, but they share some properties in common. All of them have complex, multidimensional data that can be “unfolded” around a reference visualization using complex tables. All of them are more about understanding patterns of activity than they are about viewing the data table itself, but all of the patterns project back onto a common language and sequence. I never would have thought these were the same problem at the outset: I’m looking for very different things, and they are in entirely different domains (and even different media!). It always surprises me when I stumble into it, but the similarity is there. In fact, I am now pretty convinced that learning to tackle the tools vis in R will teach me most of what I need to solve all of these problems at once. Talk about incentive!
I think that this is a really good example of why it’s worthwhile to indulge in tangents when you’re working on a project where you have the space and the time. For personal projects, I would much prefer to spend time following my curiosity and leading where my instincts take me than forcing a particular project or solution. When I take the time to really indulge in that exploration and humor my gut, I often find that these diversions contribute back to the original project in very beneficial ways. The timescales at this level of wandering tend to be far too long for anything other than side projects, but in my opinion, this is precisely what side projects are for. I ran into something hard, took about 9 mos off to play around with other things in sort of a similar problem space, and if I’m lucky I’m narrowing in on a solution that could solve all 4 problems at once. This is the best kind of synthetic thinking, and it can be so much more rewarding than just slogging through.
And it’s funny: once you’ve tapped into the flow of serendipity, it tends to keep coming. I attended a journal club with the data science team at work last week (after most of the above text was written). The paper was about AI and machine learning algorithms, and how to connect machine learning to neuroscience, for the benefit of both. The key challenge? Understanding sequences of instructions, and how they play out in networked structures, and learning to compare the details of one structure to another. Perhaps this is the seed for our next technical revolution in data science, as well. Give me a lever, and I can move the world…
1 thought on “Detour #2, Part B: Insights from Weaving”