My thesis project can be divided into roughly three different phases. I began exploring the topic and identifying relevant datasets in my Research Methods class last spring. Last semester, I continued expanding the topic and developed several different experiments for visualizing the data (links in the related posts below), as well as working on the theoretical framework to ground the project itself. This semester is a time for consolidation and simplification, working toward a more integrated piece.
By the middle of last semester, I had identified a broad network of interrelated topics that defined the importance of soil for me. In order to communicate that knowledge to others, I needed to simplify those connections into a few coherent narratives that people could experience without being overwhelmed. It was also necessary from a purely practical standpoint: there is only so much data that one person can clean, process, and visualize in a finite amount of time.
I began by writing out all of the main topics on index cards, and arranging them in different ways.

This step was mostly about framing. I could begin by presenting threats to the soil, and then focus on issues related to the most important ones. I could focus on agriculture and food production, and examine how the soil supports world food needs, accentuating its importance to human civilization. Focusing on economic development, technology, and industrialization would give more of a historical perspective, and emphasize the environmental costs of human actions. Or, I could lead with the ecological importance of soil, and all of the biodiversity that it represents.
Within each of these topics, there were datasets and pieces of information central to the story, some that were peripheral but interesting, and some that served as bridges to connect the different parts. Drawing out all of these substories helped to show where the different topics were clustered, and where the balance of my research really lay.

I presented a simplified overview of these topics in my thesis proposal presentation in December: it highlights the main topics that I thought were important, and some of the connections between them and the more peripheral subtopics.

This second view highlights the current threats to the soil (as identified by the FAO-UNESCO) show up in this set of topics.
From there, I stepped back a bit and thought about how a person might move between these different topics in a sequence, in an attempt to identify the narrative threads that would structure the visualization. I began color-coding the different narratives, and also identifying where I had the most information readily available.


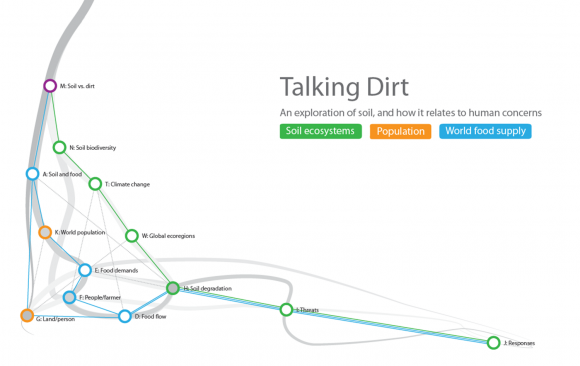
From there, I extracted a set of common nodes from the topic network, and I identified three different narratives that could connect them in different ways. I moved over into Illustrator to create a loosely-organized collection of nodes, and then highlighted the different paths between them. I highlighted the text of the primary topics, to help support simplification. That also helped to highlight the different emphasis of the three narrative options.
After playing around with these different narratives for a few weeks to see how well they worked together, I drew a combined node network in Illustrator, where it is easy to rearrange. I consolidated some of the nodes, simplified others, drew connections for each of the different narratives, and then began to untangle the different pieces step by step. (Nodes that are filled in represent which pieces of the story I actually had data for, or had started to visualize at that point.)
To this point, I had been representing these topics as a network structure, with no particular directionality. The use of narratives to connect the different nodes helps a viewer to know where to start, and also arranges the nodes into different categories. Because I had simplified the node structure to focus on these narratives, I could also begin to create a loose sense of directionality within the network; the narratives begin in similar places and end up in similar places, but take a different path through the stories in between.
I also started playing around with the possibility of using roots as an allusion to the plant-soil relationship, and as a cue to reinforce how a user might move through this story.


