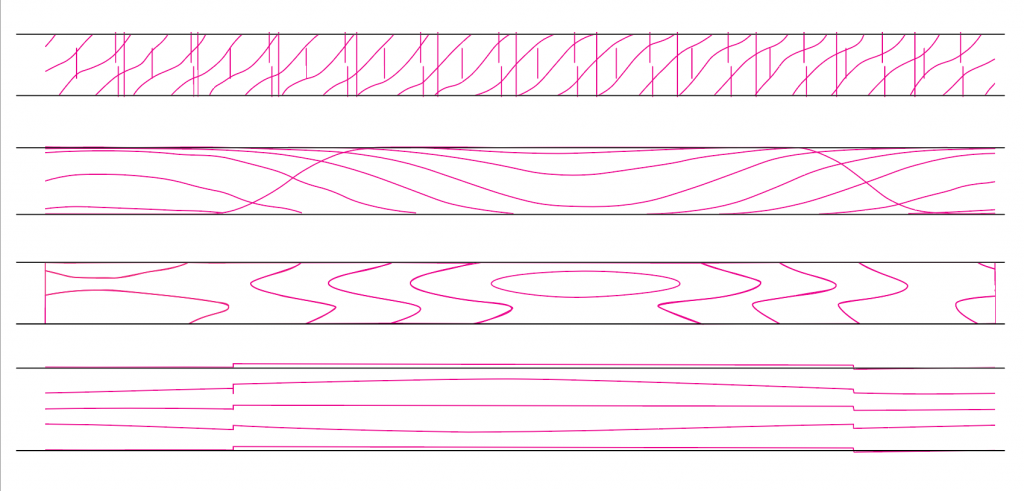
This is the first in a series of posts about a new project in the works. It’s still too big and undefined to have a name, but the theme is visualizing data related to plants, botany, evolutionary history, and the coming of spring. Use the PlantVis tag to follow along.
I’ve had a new project stirring in the back of my mind for a couple of years now. It started as a passing thought: wouldn’t it be fun to visualize the coming of spring? And it started to take shape from there. As most things do with plants, it began in the dark, quietly taking root underground, and has started to divide and multiply as the idea matures.
One of the first things I want in a project is a sense of context. For a project about springtime, weather is an obvious place to start. The data is rich, and often readily available. There are so many interesting aspects to play with, and the shared time axis of the year can be a great scaffold for early explorations.
After a bit of exploration, I settled on data from Weatherspark as a good place to start. I’m still in the exploration phase, so I didn’t want to spend time figuring out how to extract and aggregate the data myself. Instead, I traced their charts, so that I could play with the visual elements. That does limit the form that I give it, but right now I’m more interested in understanding what’s available and how the different variables relate to one another than selecting a particular form (it’s still way too early to get locked into any particular approach).

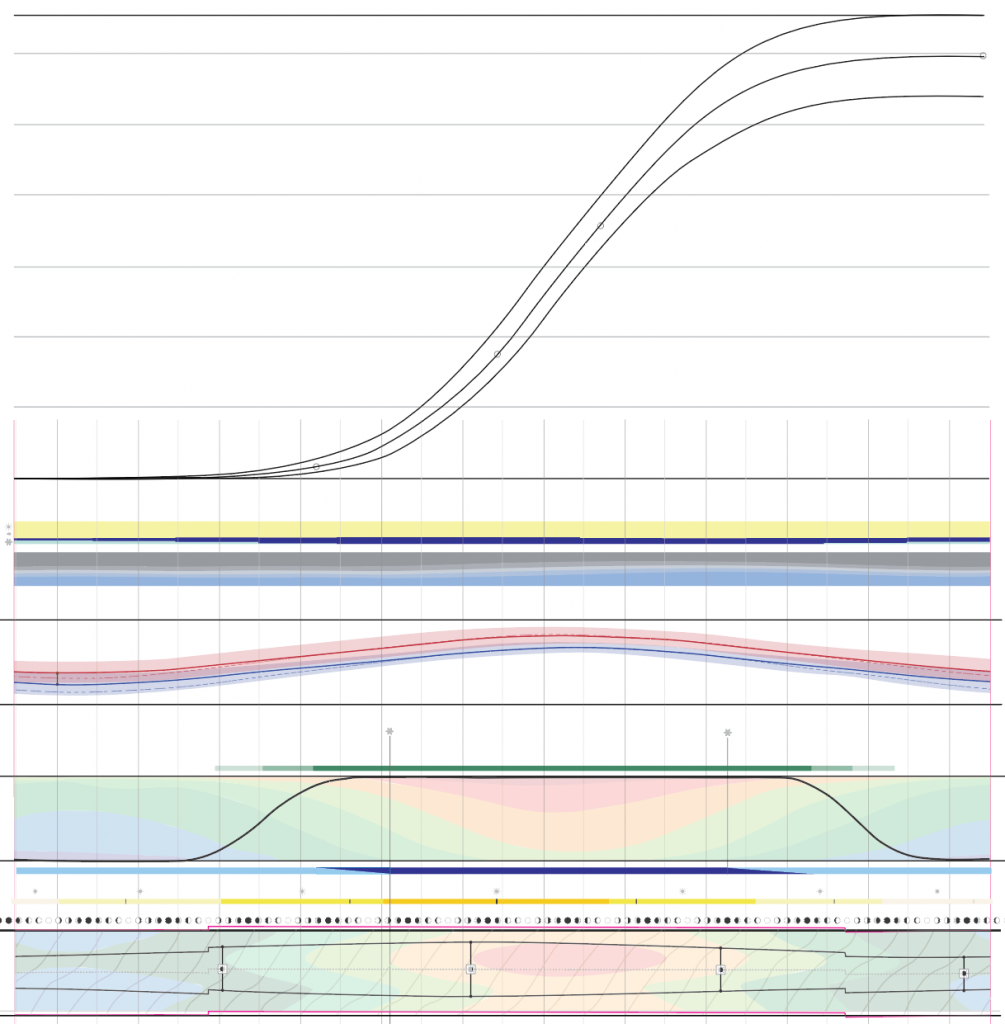
This first step was mostly a game of how many things I can fit in, and how many layers of data I can stack on top of each other. From bottom to top:
- Average hourly temperature, hours of daylight/length of day, solstice and equinox dates, moon rise/set and phase calendar
- Solar intensity and key threshold values
- Risk of frost, first and last frost dates, and seasonal transition zone from ice to liquid water
- Growing season and % of time per day spent in the different temperature bands
- Peak growing season (really just an alternate encoding for the black curve in the second chart)
- Daily max and min temperatures, and their distribution
- Average cloud cover
- Expected precipitation
- Cumulative growing degree days (this is a measure that helps to determine how long it will take a particular kind of plant to mature in a specific growing season).

There’s still a lot of work to do here, but this is enough to give me a sense of some of the variables that I could play with, and how they might all fit together, which is all I really need at this point. I love that you can already see the delay between the solstice and peak temperature for the year, based on the earth’s thermal lag. It was interesting to see how little some variables change over the course of the year in Boston – our cloudiness and precipitation patterns and our daily temperature variation stay about the same all year long. It would be interesting to compare this to somewhere with a rainy season, or maybe a desert ecosystem where the daily temperatures are more extreme.
The growing degree days portion is really the core focal point for this exploration, even though I haven’t begun to populate it yet. I am still figuring out where to get the data, and what’s going to work well there, but I’m hoping to use this as a framework to map out the different growing cycles for common plants.
As always, my project has grown before it’s even begun. I started out thinking that I wanted to focus only on spring, but now it seems like it would be a real shame to miss out on all of this interesting information for the rest of the year. The past few months have been a very long series of trips down endless rabbit holes, but those will be stories for another post. For now, I’m mostly just thinking through all the different kinds of environmental factors (and data!) that affect how plants grow, and how any particular spring unfolds. Today is just a quick sketch to understand the backdrop, to guide and inform my research phase, and so that I’ll have a good sense of context and scale when I get into the real data.
2 thoughts on “Hello to spring”