This post is part of a larger series focused on exploring the fundamental principles of data visualization. Eventually, the collection may grow into something larger and more coherent. For now, each post simply picks up and plays with one idea related to how we represent data visually. Other posts in this series can be found using the Form to Data tag.
Visual variables can be used to represent two kinds of information: identity channels that tell us what an object is or what kind it is, and value channels that give us additional information about the object itself. Each visual variable does these jobs more or less well, depending on how humans perceive visual stimuli (see a previous post on the gestalt principles of human visual perception).
Perceptual Constancy
Our innate interpretation of visual variables is based on our experience of the world around us: an object can be close by or far away, up on a high shelf or down on the floor, large or small, heavy or light. When an object is far away, it seems smaller than when it is close. When it is in shadow, it looks darker than when it’s in bright light.
None of those differences change what the object itself actually is; they just describe something about its situation at the moment. Our brains are used to adjusting our perception of objects to avoid being fooled by these changes, in what psychologists call perceptual constancy. This affects how we perceive different visual variables, even when they are used in a chart. Knowing how to match a visual variable to the right kind of channel is an important feature of making charts easier to read.
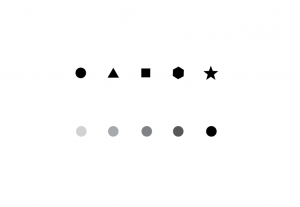
Color value, size, and saturation are more likely to be perceived as temporary properties of an item based on its current situation, and so make better encodings for value channels. Variables like shape and hue are more likely to be perceived as constant properties of the item itself (a blue ball is still blue and still a ball, even if it’s in shadow), and so work better for representing identity channels.
Ordered variables are ones that have a natural sequence, or order. Size, position, orientation and color value are ordered variables – there is a natural sequence from big to small or dark to light. Shape is not a good ordered variable: there is no obvious reason that a square must come before or after a circle.
Quantitative variables can be used to show relative value, allowing the viewer to estimate a number or a ratio from the marks displayed. Estimating values requires that you can identify the beginning and end of a range and then identify the value for the actual mark of interest, so it only makes sense to use ordered variables for quantitative estimates.
Bertin listed 5 properties of visual variables in his Semiologie Graphique. These properties are useful for understanding how well the different variables function in an encoding, and for choosing which ones to use when. The first two are the ordering and quantitative properties described above, which apply to individual visual variables even when they are used alone. The other properties of visual variables help to describe how grouping works when multiple visual variables are present, and will be considered in a future post.

1 thought on “Properties of Visual Variables”