My course in d3 and data visualization for the Northeastern graduate program was recently highlighted on their blog. I was extremely proud of the students’ final projects; they did a great job of going from zero to some pretty amazing webpages in just a few short weeks.
Course syllabus with links to weekly student work is available here. Course github repository is here (weekX repos without -student suffix are links to the course materials).
This post was first published on the College of Arts, Media and Design blog at Northeastern University:
https://www.northeastern.edu/visualization/allprojects/studio-visualization-technologies-fall-2017-learn-by-doing/
One of the Fall 2017 Visualization Technologies course sections was taught by Erica Gunn; an alumna of the IDV program who graduated in May of 2017. Erica was previously a professor of chemistry at Simmons College, and currently works at SHYFT Analytics as a Senior Data Visualization Designer, creating the data visualization infrastructure for an enterprise application that supports cloud-based analytics in the pharmaceutical sciences.
Students in the Visualization Technologies course came from Journalism, Architecture, and the IDV program. Most had no background in code, and many were creating webpages for the first time. The class focused on building interactive web visualizations using Javascript and the D3 library.
Erica adopted a hybrid lecture-studio model for the course, because she believes that the best way to learn is by doing, and that it is important for students to leave a class with a real-world demonstration of their practical skills. The course had two primary components: a skills-building portion that gave students as a brief introduction to HTML, CSS, Javascript, and the D3 library, and a semester long project that stretched their boundaries and led them in new, creative directions. Students began brainstorming ideas for their final projects even before the first day of class, and continued reporting in on project development throughout the semester. The skills-based portion of the course introduced students to the basic tools needed to build visualizations for their projects, and the studio portion provided continuous feedback and support in developing their project ideas.
By the end of the course, each student had created an interactive website on their chosen topic, suitable for use as a portfolio piece or as the first draft of a larger project. Two students collected their own data for the project, while others worked with datasets published online, cleaning and trimming them to suit the project needs. Topics included housing choices in Boston, tracking stock market indices, comparing renewable energy resources, a history of state-based marijuana legalization, and an ethnographic study of what people do on the Orange Line.
Felippe Rodrigues (Journalism) created an animated timeline showing DACA progress in recent years, as a supplement to an article that he co-authored as part of a class in the journalism program.

Nicole Zizzi is a dancer and student in the Architecture program. She worked with a database that shows the career trajectories of professional dancers, creating an artistic illustration of how dancers move through their careers.

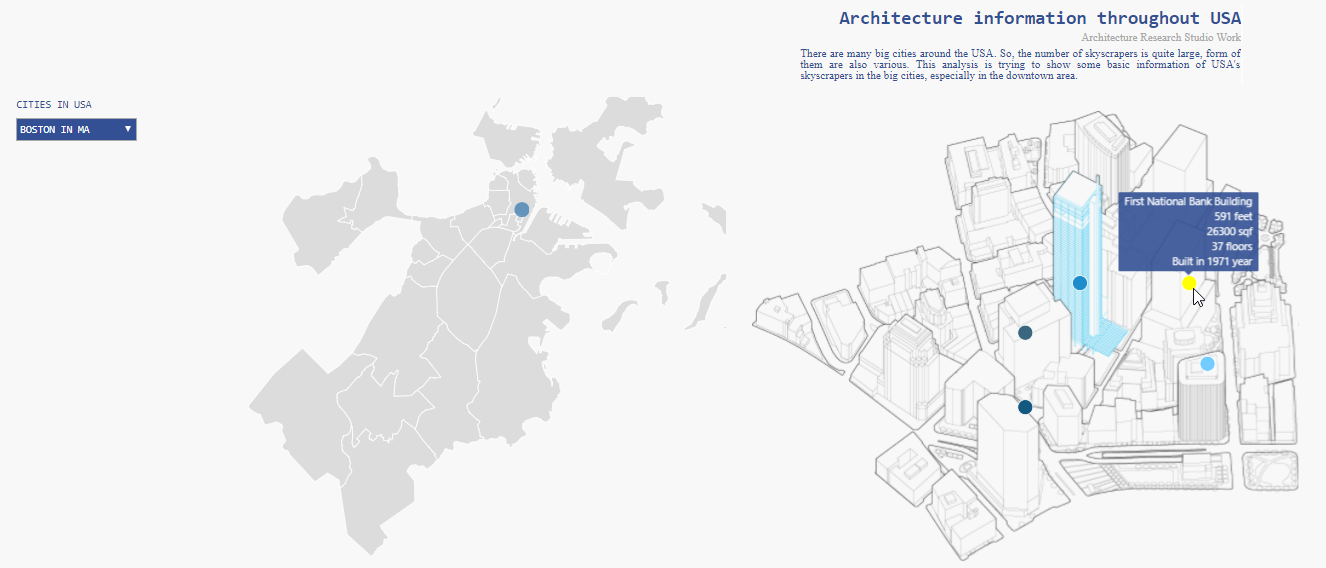
Yuanhong (Angela) Shi (Architecture) used D3 to supplement her architectural drawings in comparing major buildings in different American cities.
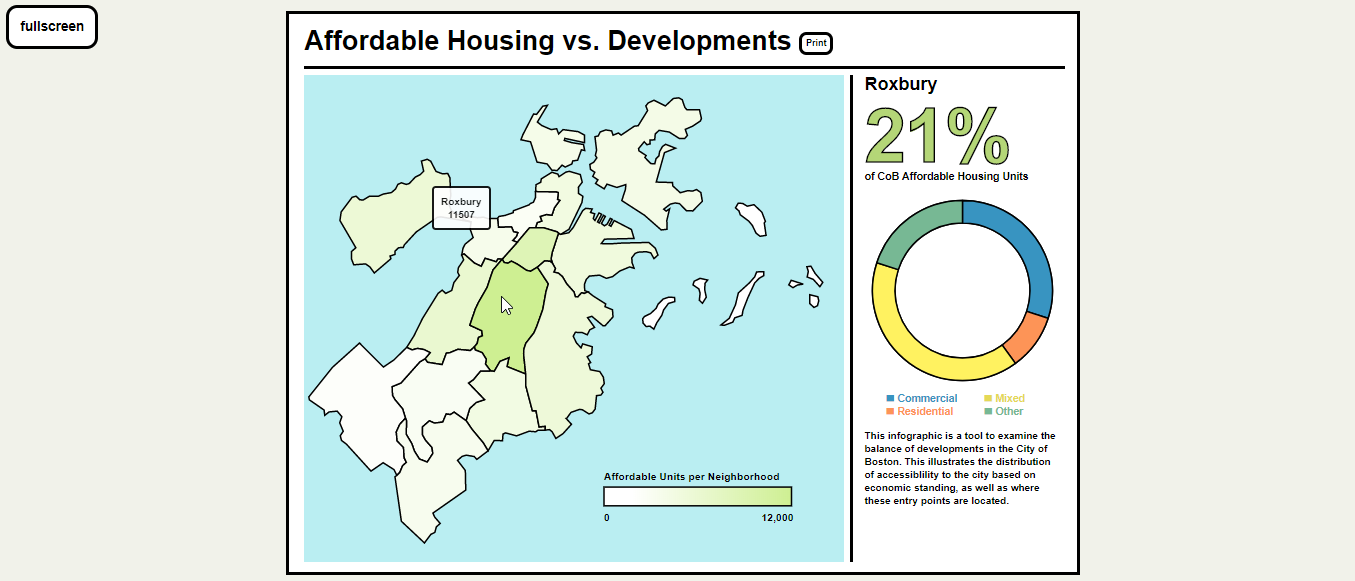
Stephen Costa is a student in the IDV program and works for the City of Boston. His project focused on summarizing affordable housing units in the Boston area, as a pilot for a deeper exploration of the data that the city collects.
Links to all student work is below:
Xun Chong: Stock
Stephen Costa:Affordable housing vs. developments
Felippe Rodrigues: DACA Might be ending soon. Here’s why you should care.
Sophia Fox-Sowell: Westerosi Houses Separated by Regions
Kuan Lin: Clean Energy Analysis in Hawaii
George Redak: A League of Home Runs and Singles
Angela (Yuanhong) Shi: Architecture Information Throughout USA
Abigail Skelton: Marijuana Laws Across the US
Ziyi Zhao: Orange Line
Nicole Zizzi: When Data Dances
Qingyue Li: WithinX Fenway App
Yichia Cheng: Where to Live in Boston?