This post is part of an exploratory series for a new project that will visualize data related to plants, botany, evolutionary history, and the coming of spring. Use the PlantVis tag to follow along.
In the last post, I talked about getting back into the bloom calendar portion of the original project, after some trips afield to explore the relative size and evolutionary history of plant families. I have downloaded several spring planting guides that give some information about common garden plants, but I was looking for data that spoke to spring more broadly. I found a pdf of an old paper published by the Arnold Arboretum in 1950 that gives the bloom sequence of 770 plants in Massachusetts. Of course, it’s an OCR’ed document because of its age, so pulling data out of it was a very manual process (at least it had been OCR’ed, so I could start with a copy and paste and edit manually from there). After extracting each row manually and formatting them into a working .csv, I am now working through the list to identify common names for each plant, running a manual Google search on each individual line item. There’s nothing really useful to do with that data quite yet; it will need quite a bit more cleaning to get to a point where it can be useful for visualization, but at least it’s moving forward.
In the meantime, I’ve started reading a book on botany for gardeners, and exploring other data sets that may be interesting. The planting guides got me thinking about cultivated vs. wild plants, and the different purposes for cultivated plants – some garden guides focus only on ornamentals, others only on vegetables, etc. The Arnold Arboretum paper focuses on horticultural plants of interest to a large botanical garden, so those are mostly trees and other landscape specimens. I think that these different categories will be something useful to pursue, and they will probably make up some part of the bloom calendar eventually. It’s hard to find a single (and comprehensive) list to work with, though, so it’s going to take a bit more digging to build a unified dataset for that kind of comparison.
I also started searching for datasets related to food production. My botany book states that:
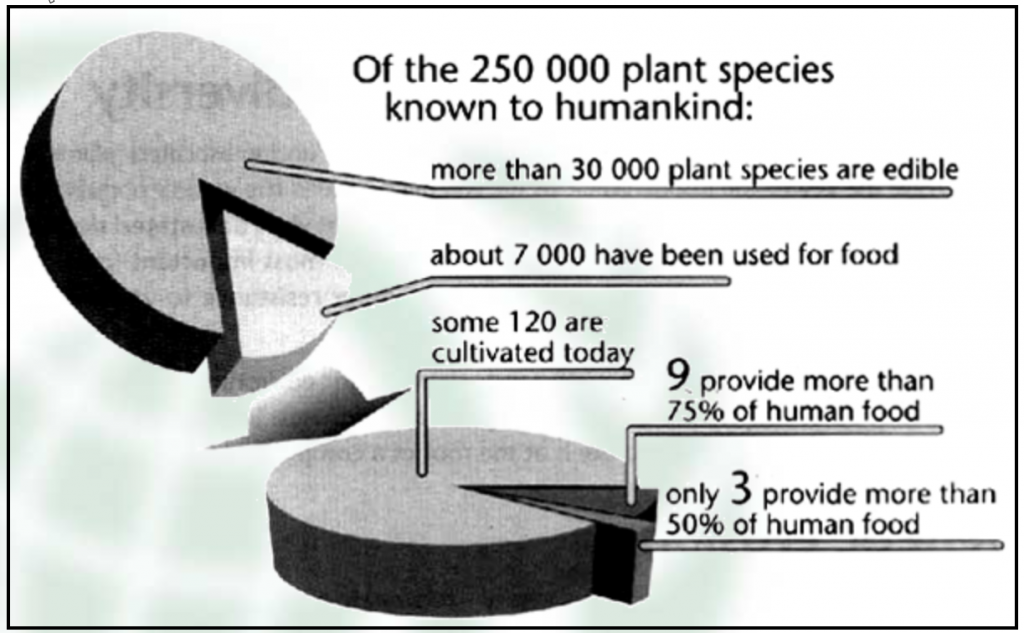
“Out of the vast array of plants that populate our planet, only about 2000 species are estimated to have been used by humans as food. Of these, forty species are listed among today’s major food sources; and of these, a mere fifteen species are considered the plants upon which the human race completely depends.”
This seemed like a promising and interesting area to dig into, so I started some poking around to find a source for these statistics. They’re quoted all over the place online (though the numbers vary a bit from source to source), often without citation. The FAO website has an old infographic version with 3D floating pie charts:

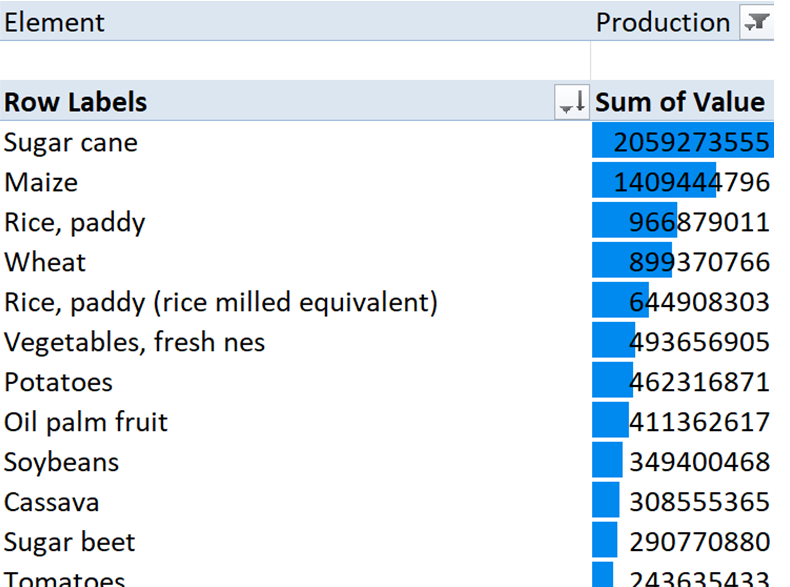
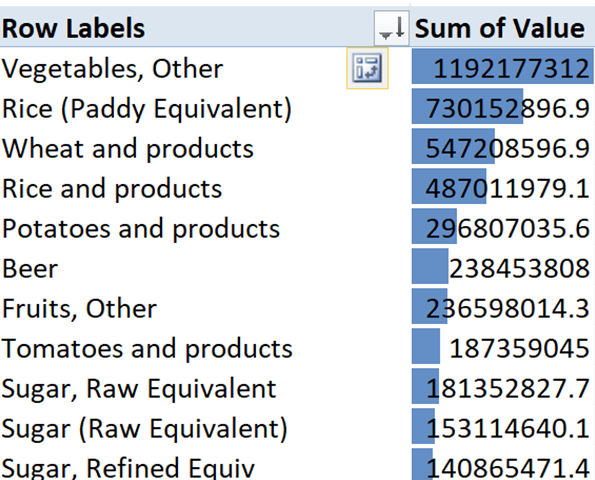
It looks like the primary source is from the FAO, but I wasn’t able to find a single publication that listed out their analysis. I did find an interesting report on biodiversity in food systems, that may be worth a closer look. For now, I ended up going back to their FAOSTAT site, because I suspect that the statistics are quoted from an analysis of their annual data. A couple of downloads later, I had a list of the total annual crop production worldwide, and also a dataset that’s more focused on food crops specifically. These were clean enough to be within reach of a simple pivot table combined with conditional formatting to get a quick sense of scale (value is in tonnes per year).

Sugar cane is top for production, but a lot of that is used for production of ethanol and other non-food uses. There are clearly some groupings that I’d want to clean up (rice and milled rice should probably go together for my purposes), but this will be a pretty easy dataset to use, if the project goes this way. The food production chart has a different order, and uses some additional groupings. “Vegetables, other” is one I would particularly like to break out. So, definitely some work to do here to get out what I want, but also some good information to dig into as a place to start, and it’s reasonably accessible for high-level analysis. I worked with the FAO data before in my soil & land use project, and it’s great for getting a comprehensive view of global statistics. I’m not ready to go there right now, but it would be interesting to break the different cultivation groups out by country or region of the world, to see which plant families are relied upon most, and where.

For my current purposes, the definitions files might be a little closer to what I need. Along with each food category, there is a description that lists out the items that it contains. Many of these have latin names (from which we can figure out the plant families), and others have common names or descriptions. There will definitely be more manual work to extract these, but this would give me a pretty good list to work from on the most common crop plants.

So, more work to do here to pull this out into a useful form, but it’s getting me a step closer to what I need, if I decide to go in this direction with the final project. I like the fact that it ties in a human interest part of the data, but I also don’t want to frame the project solely in the context of plants that meet human needs. So, another area to put a bookmark in and come back to; I think the dictionary will help me with some of my other indexing for now, and this was at least an interesting little side diversion from the endless Googling of tree names. I’m a little less than halfway through the list, though, so hopefully it won’t be too much longer before I can get something a little more tangible from that dataset.