We’ve started moving beyond simple code sketches in my IDStudio II class (with Noah Passel). We all took a “getting to know you” survey on the first day of class, using Google Forms. This week, our assignment was to take that data and visualize it using d3.
Noah provided all of the code to interface to Google Forms, including a dropdown menu for selecting different items. The dropdown menu needed to update frequently in case of a user selection, and the Google Forms data was reimported every 5 seconds, in case of changes to the spreadsheet.
This was my first time working with auto-updating code in d3 – it actually felt a lot like working with the “draw” function in Processing. The way you structure your code has to change in order to avoid overwriting things that you don’t mean to overwrite, and you have to change the way you think about passing values in and out of the repeating function.
There were a few other things in Noah’s example that were very different than I’d seen before. We always created the svg element from within d3 in Siqi’s class last semester, but Noah had it hard coded in the HTML. I was able to work with that for the first graphic, but for the second one I had to change it. He was calling several functions stored in different files, which worked their magic in the background and reported with a callback when the load routine was done.
In all, it was hard for me to wrap my head around what was going on (even after Noah’s explanation in class), because the code structure was so fundamentally different than what I’d done in the past. It was good to get some experience with a different way of approaching things, though. In the long run it helps to be a more flexible and well rounded programmer.
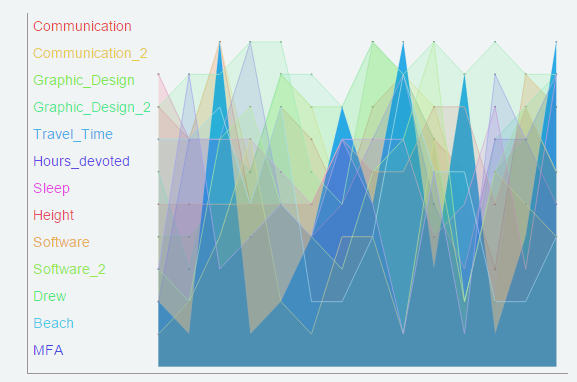
I think the first graphic is my favorite, though it’s probably not the best information visualization because so many data sets are overlaid on top of one another.
I ameliorated that problem using interactivity. If the user mouses over a question topic on the left, the correct dataset changes transparency so that it stands out.
Unfortunately, I still haven’t figured out one important part of the timing, which means that the graphic doesn’t refresh right away when the user’s mouse leaves. (It does refresh eventually, but it’s far too slow for practical use.) There were a couple of hacks that I really didn’t think should be necessary in my code, but after spending about 10 hours on the assignment I just needed to make it work well enough and move on.
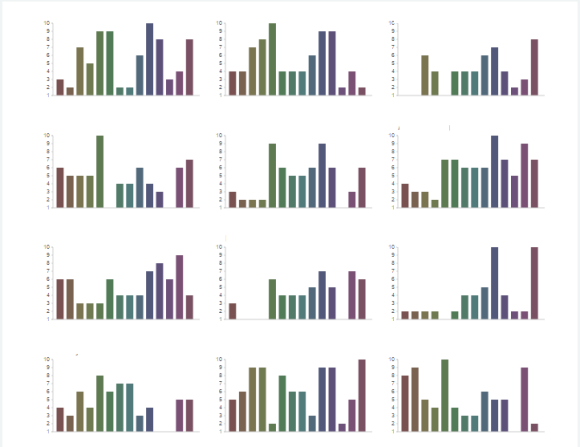
The second part was also much more difficult than I’d expected it to be. I made a simple bar chart in about 5 minutes, and then decided that I wanted to push myself a little and try for small multiples instead. I found a couple of great tutorials on making interactive small multiples, and it seemed like this should be pretty simple code to write.
It turned out that it wasn’t. To make the small multiples work, I had to change some of the basic structure of the code, because d3 needs access to the canvas directly to draw a separate svg element for each graph. There was something weird going on with the CSS styling which took several hours to locate and sort out – I still do an awful lot of bumbling around in CSS, and there were at least 3 stylesheets running on this one project, so figuring out who was forcing what was a bit of a challenge. I did get it working in the end, though the time spent on code restructuring meant that I didn’t have time to do as much fancy d3 work as I would have liked.
I had planned to add interactivity on this graphic as well (each chart stands for a particular person – I removed names in case my classmates didn’t want to be identified on the blog). If things has gone smoothly, I planned to show the value for each question for each person: when the mouse hovered over a bar on one graphic, I wanted to print the numerical result and highlight the corresponding bars for each of the other people in class.
When things got stickier than I’d planned for, I ended up having to burrow pretty deep in the d3 data structure to get what I wanted. I wasn’t thrilled with my final code for this assignment. I’m sure there’s a much more elegant solution, but it’s what I could make work and still get my other assignments done. And, considering how hard it was to get even the basic things to work, the graphs don’t look too bad, in the end.


