This project was an assignment for my Visualization Technologies class with Pedro Cruz at Northeastern in the spring semester of 2016.
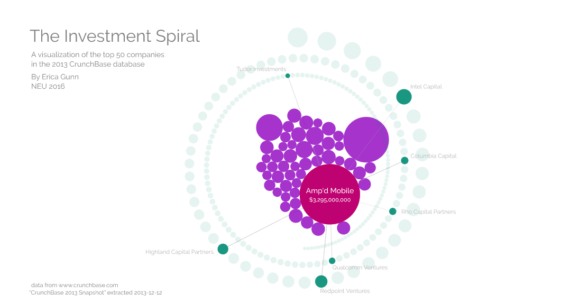
We were given a set of data from the CrunchBase database, containing information about companies and investors for 2013. We parsed the data file to find the top 200 companies, and programmed an interactive visualization using p5.js. I chose to highlight the interactions between companies and investors, to allow users to look for patterns in investment sources. The live version of the project is available here.
A note on browsers: All of my web applications were developed using Google Chrome. I have run into occasional problems with some versions of Safari and Internet Explorer, and would recommend viewing with Chrome. The blog posts linked below have additional screenshots, in case the live version isn’t working.
Further details about the project development can be found in the related blog posts, below.
