This project was an assignment for my Design Studio 2 class with Noah Paessel at Northeastern in the spring semester of 2016.
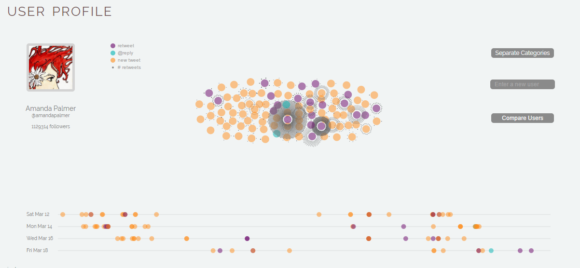
The goal of this project was to create a visualization of an interesting aspect of social media using an API. I chose to focus on exploring characteristics of conversation on Twitter, and developed a visualization to show the ratio of retweets, replies, and new tweets in a user’s profile history. The application allows a user to enter a Twitter profile handle, and then queries the Twitter API to make a visualization showing the user’s tweets, and a timeline to show their activity patterns. A second page of the visualization allows comparison between different users. The live version of the application is here.
A note on browsers: All of my web applications were developed using Google Chrome. I have run into occasional problems with some versions of Safari and Internet Explorer, and would recommend viewing with Chrome. The blog posts linked below have additional screenshots, in case the live version isn’t working.
Further details about the project development can be found in the related blog posts, below.
