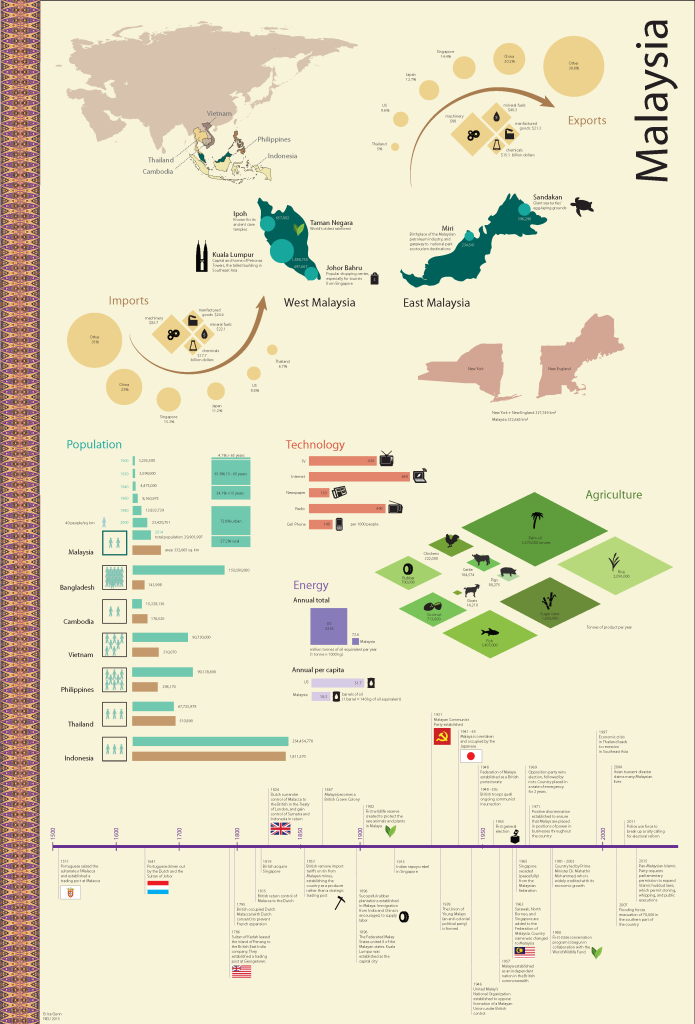
This project was an assignment for my Information Design Studio I class with Douglass Scott at Northeastern in the 2015 fall semester.
We were asked to create a poster for an assigned country that contained 20 different kinds of economic data, which were specified in the assignment. This project developed skills in organizing information, creating a coherent visual theme, and using labels, graphics, and symbolic language to convey numerical data.
Further details about the project development can be found in the related blog posts, below.
