I served as Director of Education for the Data Visualization Society from June 2021 to January 2023. Over that time, I donated over 1100 hours of volunteer time to the organization. I supervised 8-12 volunteers across two global/remote teams. I also hired and supervised one contract analyst and acted as secondary advisor to a thesis student doing his master’s in data science.
Strategic consultation

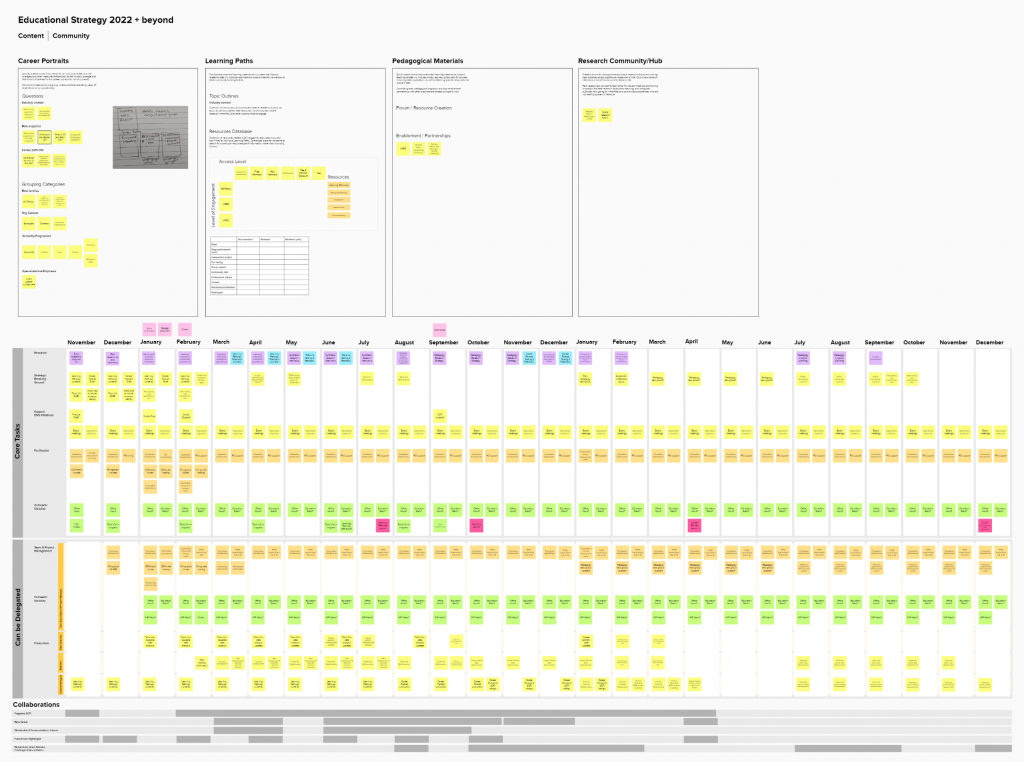
The DVS education program is still in its early stages of development. One of my first challenges as a new board member was to define a robust long-term strategy that also created value for our members today. I worked closely with our executive director to outline a long-term vision for the education function within DVS. This included a full website of community-contributed educational resources, a certificate and workshop program, and an interactive career navigator that would help members to chart out their career path and educational goals within data vis. Next, I completed a review of our existing educational resources and opportunities in these areas.
Then we assessed each opportunity from a few different perspectives:
- What will be most useful for our members, now and in the future?
- Where do we have existing assets that can be leveraged in new ways?
- Where can we provide unique value?
- What aligns with work that we are already doing, or future plans for other functions?
- What is achievable now and moves us toward our goals?
Using these different lenses, we identified three major workstreams where we felt we could make progress, set reasonable expectations for delivery within my tenure, and sketched out acceleration paths using paid resources to support future funding proposals.
Career portraits

This project had the most immediate external benefit, and was a primary focus for most of my board work. The DVS runs an annual State of the Industry Survey, which is one of their flagship events for the year. This includes in-depth career questions, and paints a picture of work across our field. I performed an introductory analysis of the dataset, and produced a proof-of-concept outline that I reviewed with the team. We hired a contract analyst to help me extend that analysis, and to refine and speed up the work.
Together, we wrote and published a 30 page report that outlines 4 major career areas within data vis, leveraging our unique survey data asset to support people entering the field. I also collaborated with and served as master’s thesis advisor for a data scientist to explore NLP data tagging and clustering analyses to extract more in-depth information from the dataset. Both projects developed reusable code in R and Python that can be used to support future work at the DVS.
In addition to the aggregate data analysis, we also wanted to include a more human perspective focused on individual careers in the field. Amanda Makulec organized an interview series with DVS founder Elijah Meeks to talk about career paths. I performed a secondary set of interviews with DVS members who volunteered to talk about their careers, to round out the collection and include people across all stages of career development. I collected additional survey information from these interviews, and compiled them into the Career Portraits portion of the report.
Resources and learning path development
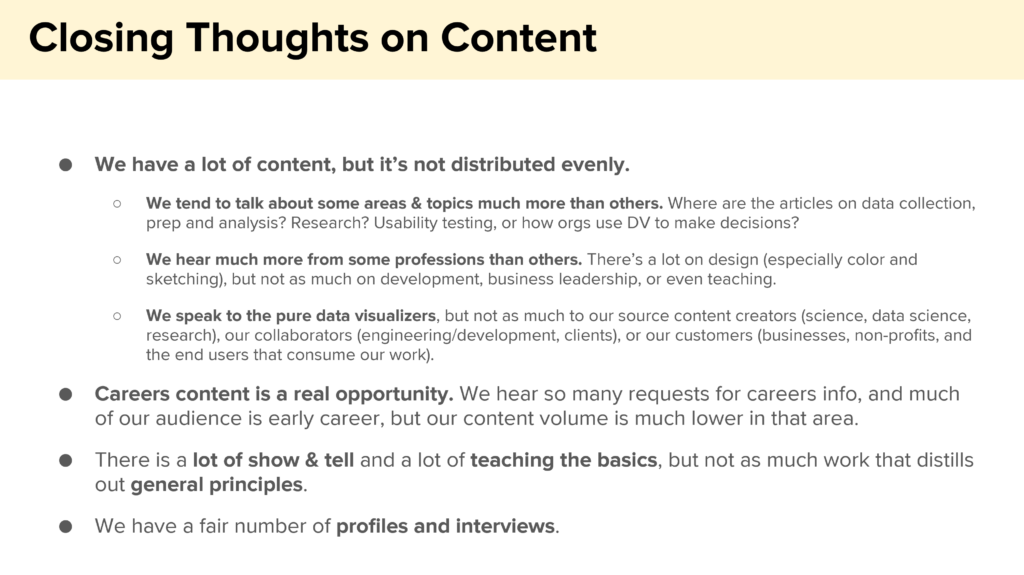
This initiative was part of a longer-term project, intended to support development of educational resources and certification paths within data vis. I compiled and tagged all of the existing DVS digital assets, evaluating for member interest, common topics, and areas where we had the most to contribute in the discussion.


I worked with my committee to develop these and other topic areas, and to build more structured self-learning pathways to support members interested in learning new skills. This was much longer, slower work, because it required more expertise and in-depth engagement with the subject material. A few stellar volunteers completed early drafts and initial outlines for 8-10 learning paths. Topics included: designing for visualization, style guides, accessibility, data literacy, and many others.
It turned out to be more difficult than expected to add these assets to our existing webpage, and the DVS decided to pause publication until they are able to build a separate educational section of the website. Still, conversations around these assets helped to structure and inspire 1.5 years of conversations with our members about their interest areas, including monthly Slack events and live online discussion groups. These conversations informed later workshop and event planning, and created a solid basis for future work in this area.
Pedagogical resource space
This was the longest-term initiative in the agenda for my board term, and was the most exploratory in nature. In addition to creating a learner-focused area for educational topics, we also wanted to compile an archive of instructor-focused work. I created some early conversations to understand how people would want to use and contribute to a community and resource exchange center for people who teach or do research in data visualization (either in academia or professionally). While there was strong interest in this initiative, the complexity of creating the website and the smaller short-term impact made this one a lower priority than our other work. Again, this would be an excellent opportunity for sponsorship and partner relationships with other organizations, and my early discovery helped to support those ongoing conversations.
Connecting with members
Throughout my board tenure, I focused on connecting with DVS members directly to vet ideas, solicit feedback, and provide advice and support. As soon as we had an initial strategy, I published an article in the DVS’ online publication, Nightingale, to solicit member thoughts and reactions. I collaborated closely with the Early Career director to build conversations around career paths, and we held monthly Slack chats and live video calls to discuss early results and topics of interest, and to create spaces for the community to engage with one another. I also collaborated closely with the Programs Director on survey question development. We used the Career Portraits work to publicize the next year’s survey, and arranged many events, publications, and announcements around that event.
I also tried to give back in ways that aligned DVS board objectives with member interests and needs. Sometimes there is a simple action that can just be addressed today, rather than getting bogged down in a formal initiative. Based on member requests during our Early Career discussions, I began a series of in-depth articles about how to structure and manage the design and visualization process, and the process of learning in visualization. This wasn’t really part of my core board objectives, but it was a simple step that responded to member requests in a visible way, and people are still reaching out to say that they find value in the series. I also held a series of open demo sessions on Adobe Illustrator and Figma, because our members were interested in learning more about these tools. It was a simple thing that took an hour of my time to present, and it gave members an inside view into the work behind a major board project at the time.
This constant feedback loop helped me to stay in touch with DVS members and their interests, and it helped me to test out different ideas, directions and visualizations that informed our final published report. Discussions with members around data literacy also helped to inform our approach to learning paths and other teaching-related content. A good organization (or company, or team) is driven as much by its members as by its leadership, and it’s always the conversation between the two that moves the group forward.