(Password protected)
Design Metrics for Team Support
It is almost always better to measure than guess, and strong design practices support good business. There are multiple studies from McKinsey, IBM, InVision, the Design Management Institute, and others that emphasize the business benefits of good design. Like anything else in life, unlocking those benefits is often far from simple.
I took over a small design team in January of 2022 under some pretty serious headwinds. We also had some pretty serious responsibility: my company develops the software that runs clinical trials, and our industry was still reeling from the impacts of the COVID pandemic. Our clients were counting on us to see this through, and there was no space to slow down.
In spite of the challenges, we doubled down as a team, focused in on what was important, got our work done, and we made significant progress across the past 3 years. We moved from a UI-focused design team to one that participates in strategic and user research, for all products (though still to varying extents). We grew our coverage from 4 products to an entire division of the org (currently somewhere between 10 and 13 products, and counting). We partnered with the core company design team to begin integration into a new style system, contributing use cases, patterns, and module designs to support design consistency and faster product development. We became strategic partners for our product areas: a team that creates possibility and holds space for the big dream, as well as a team that gets things done.
We did this by establishing a standard process for work requests, creating a flexible allocation plan for the team, and focusing heavily on skills development and professional growth for all members of the team. Here’s what the measurement side of that process looks like.
First, we collect work requests from across all of our products and partners on a quarterly basis. We also articulate the design work that needs to be done, for clear visibility into where we are investing our time (most of it goes into more exploratory research projects, team development, and maintaining the style system that we use to support our products).
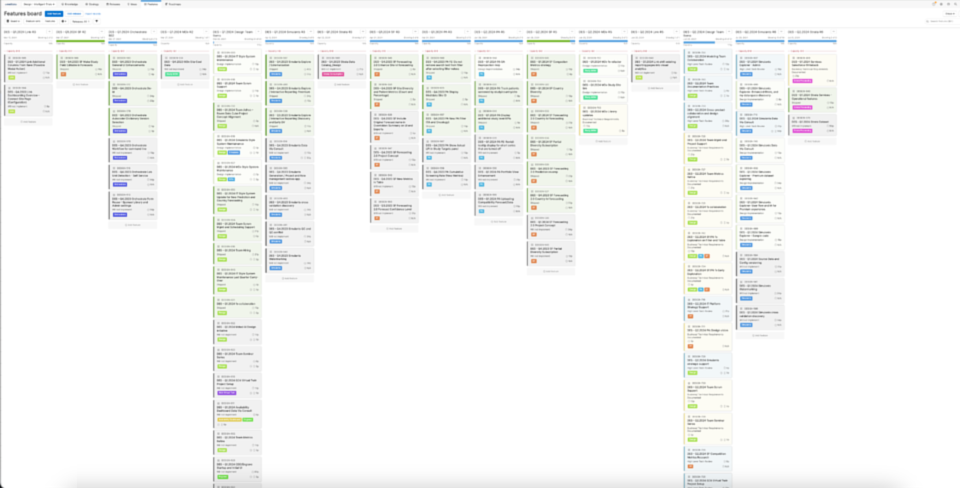
There is a lot of work to cover, and with only 4 designers (including myself), we need to stay organized and focused in order to keep our many parallel releases on track.
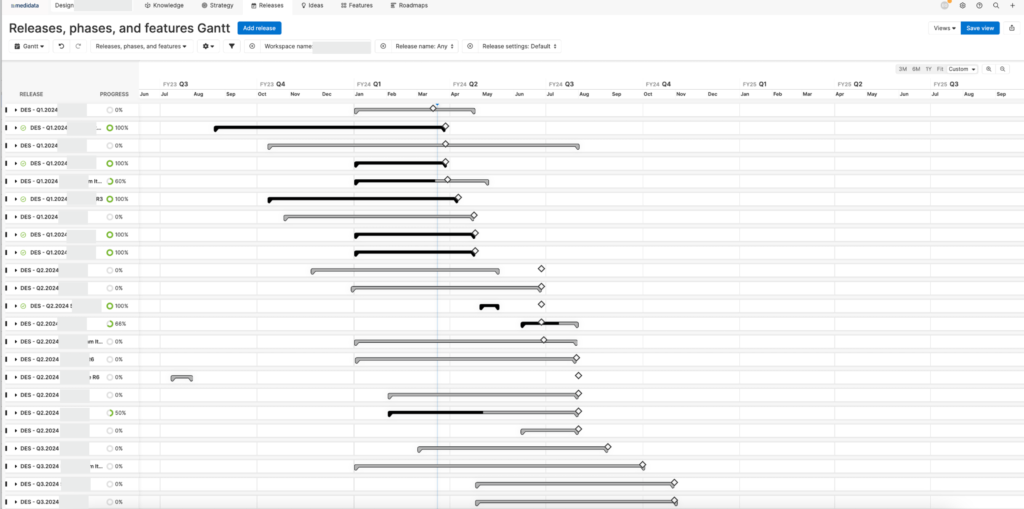
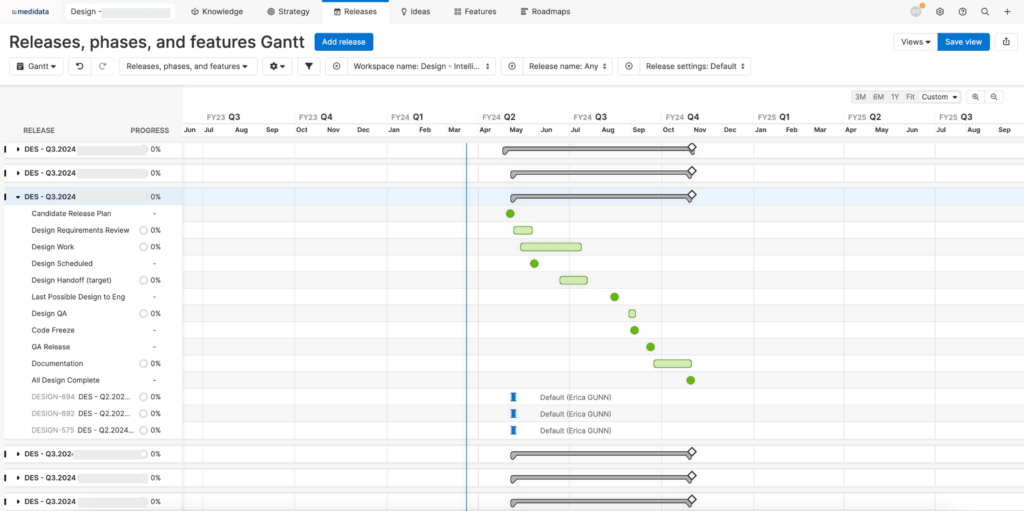
For each release cycle, we have a set of standard stages for when design requirements should be ready, when they should be reviewed, and when we should deliver to keep the release on time. Some products follow this process better than others, but having the structure in place allows us to at least have the right conversations at the right time to keep things on track (and for guilty parties to own the fact that it isn’t on track, when things do slip).
Once the work requests are compiled, I have a simple spreadsheet that helps me to create a detailed allocation plan.
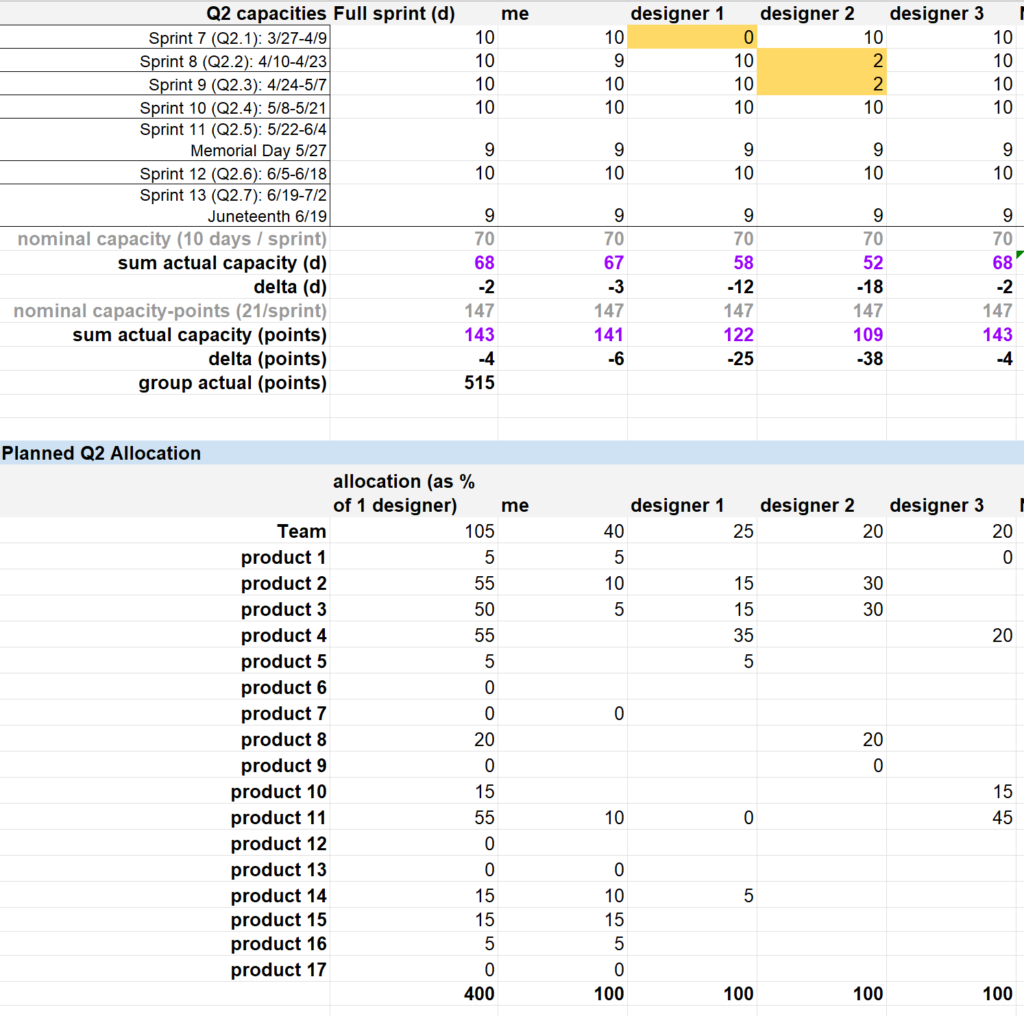
This fairly basic setup lets me do some useful things. I can use a graph of proposed vs requested allocation to discuss priorities with leadership. We can also look at allocations over time per product, to understand how the new requests fit into the picture for long-term development.
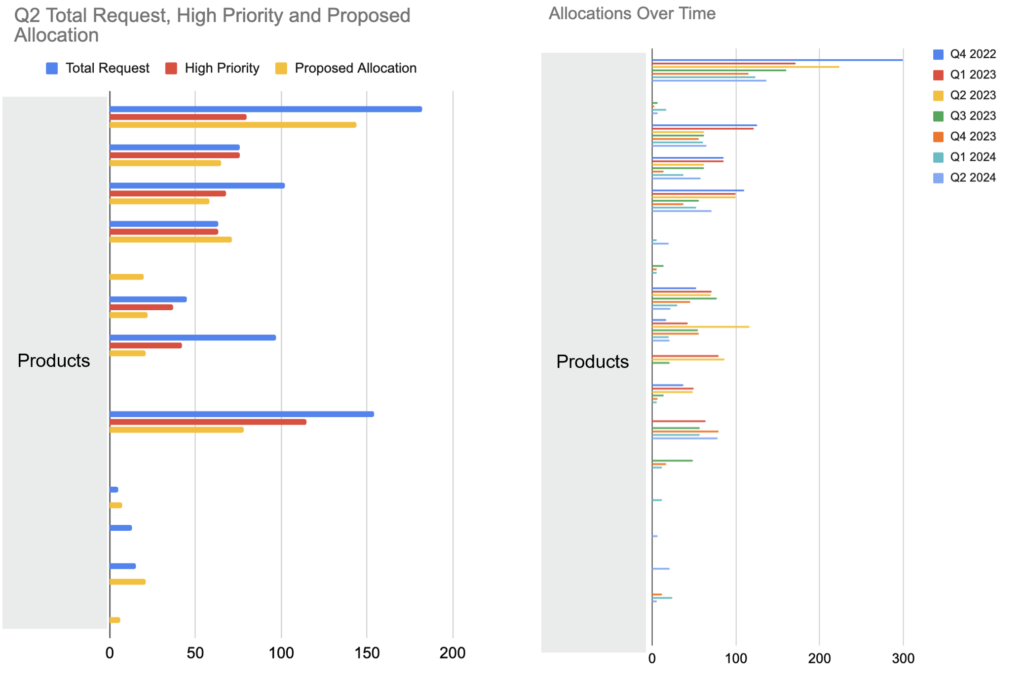
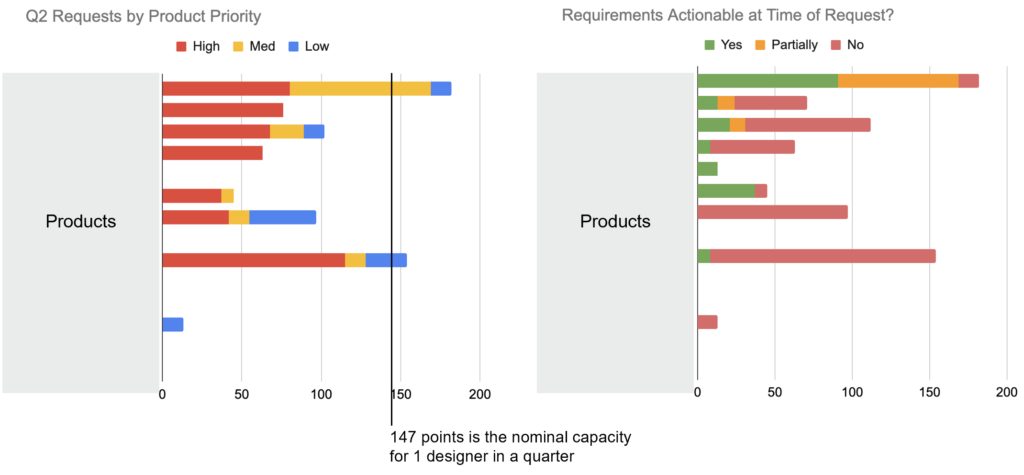
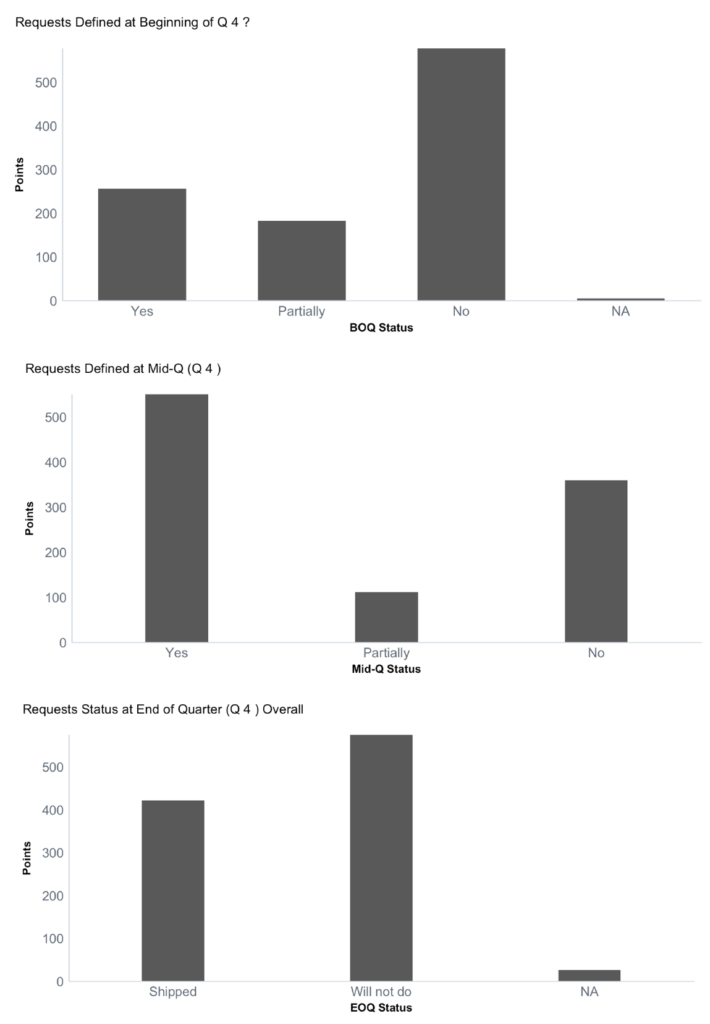
I also track how the product team prioritizes requests, and whether they are defined enough to be actionable: at the time of request, the beginning of the quarter, the middle of the quarter, and whether or not we deliver them at the end of the quarter. This helps to keep all parties accountable for both defining and delivering their piece of the project.
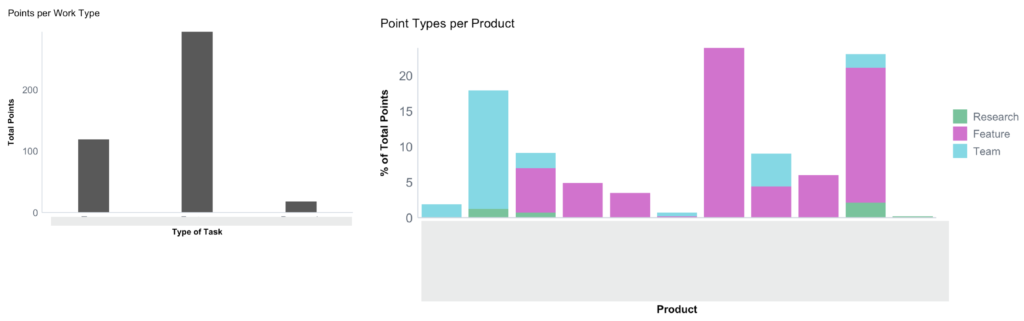
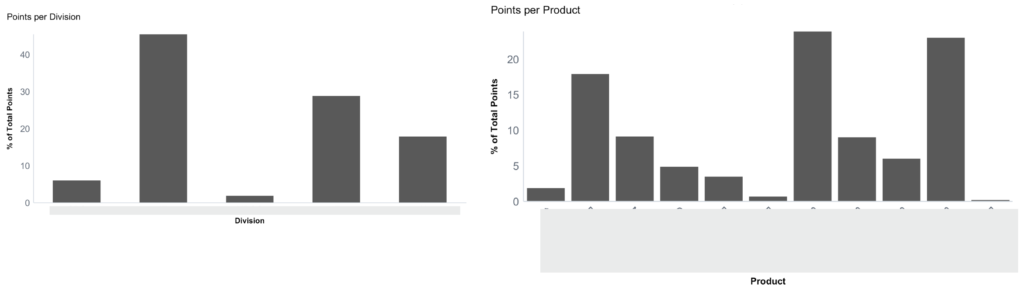
I also use the team historical metrics for more ad hoc or holistic analyses to check in on team health and calibrate expectations from time to time. When I first took over the team, I compiled 2 years of data for a single product suite to identify what kind of design resources a “typical” product consumed, and where we focused the work.
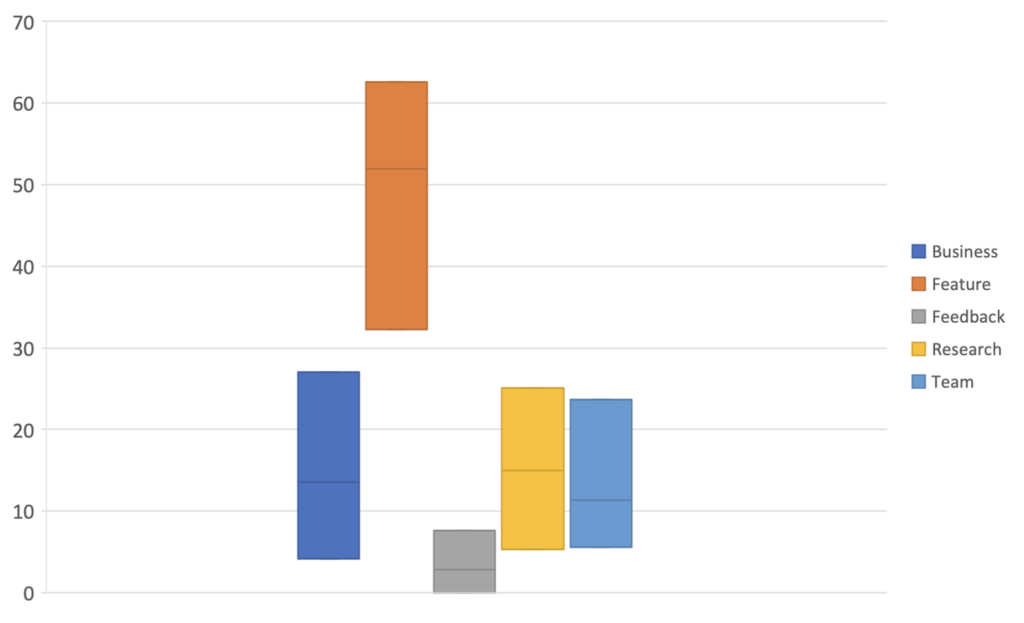
Done longitudinally, this kind of benchmarking also helps to check in on whether we are allocating enough time for research or team tasks, or whether we’re starting to skew too heavily toward feature work. The latter might just reflect temporary team and product priorities, or it might indicate that we don’t have enough designers to support critical tasks outside of delivery and to keep a healthy work balance for the team.
This benchmarking also helped me to assess what an “average” feature should look like, which helps with calibrating and sizing for new designers and new product teams.
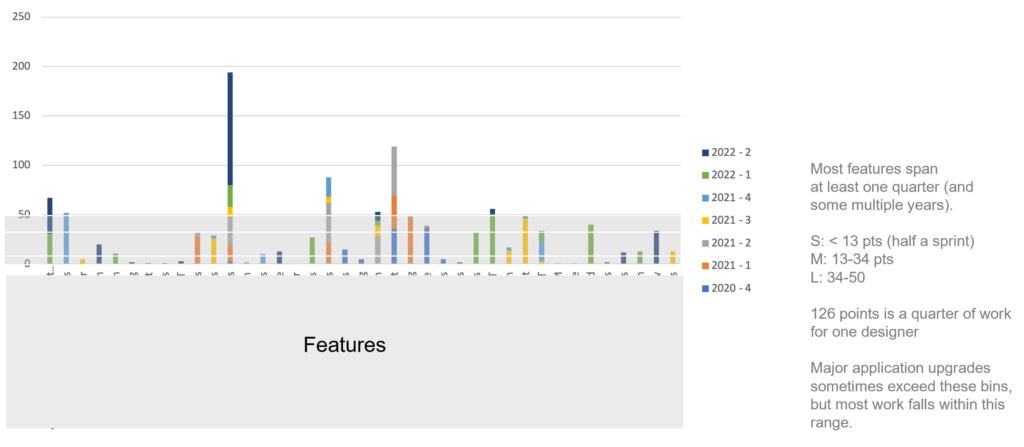
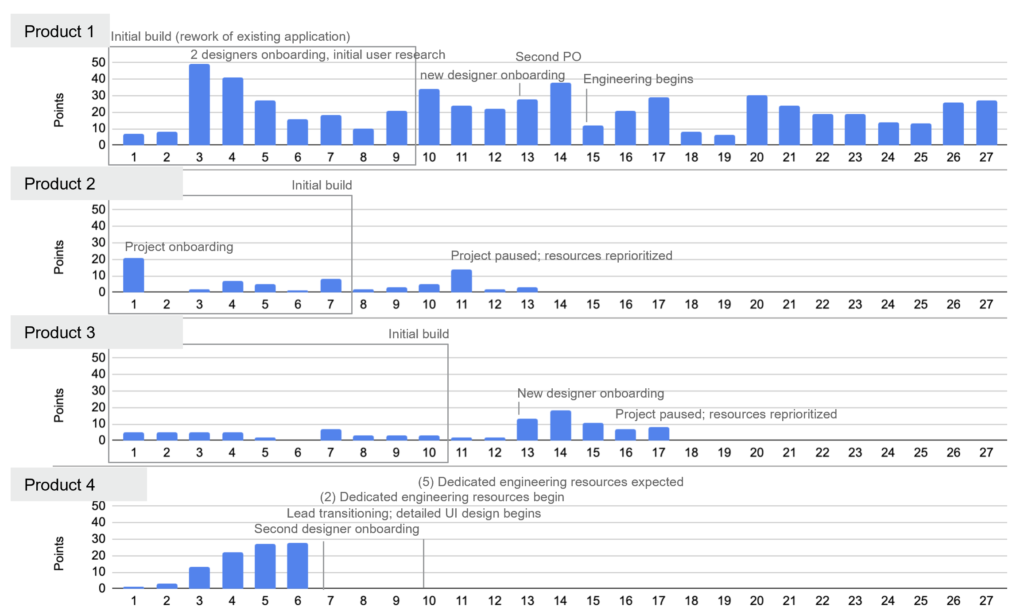
I’ve also been able to track the startup activities for a variety of products. Some start out small and stay steady over months or years. Larger projects often have a couple of quiet quarters while we figure out what we’re looking at and then a few quarters of very heavy lifting while we do the initial build and bang out some core features, followed by a few recovery quarters while we reconsolidate and prep for the next big push. Other projects come out of nowhere and ramp up fast, consuming all resources in sight. In that case, these broader metrics help us to evaluate whether all the clamor is really necessary, and to measure the efficiency of that team against others of similar size.
I use several of these metrics to support decisions around team resourcing. If the feature balance gets too far from equilibrium for more than a quarter or two, it’s probably time to start talking about infrastructure and the importance of non-feature work. If the product team is defining work and we’re not able to pick it up, that’s a sign that we need to reprioritize or grow the resource pool. If product requests are dropping across the board, we might want to close out that new req we opened, unless we’re sure that this demand softening is a short-term thing (I have made that decision more than once).
In the space of one particularly tumultuous year, we lost two long-term designers and I hired, onboarded and trained a total of 7 designers in the course of one calendar year. I created the graph set below to talk about why contract resources might not be the best fit for us in terms of productivity, even though they are cheap and quickly available. With all of that churn, our total productive design time changed very little, and others were focused on supporting the constant turnover, quality checking, and training. Our core delivery held solid and even increased slightly, but not enough to make up for the overhead costs and the sheer exhaustion caused by this particular hamster wheel.
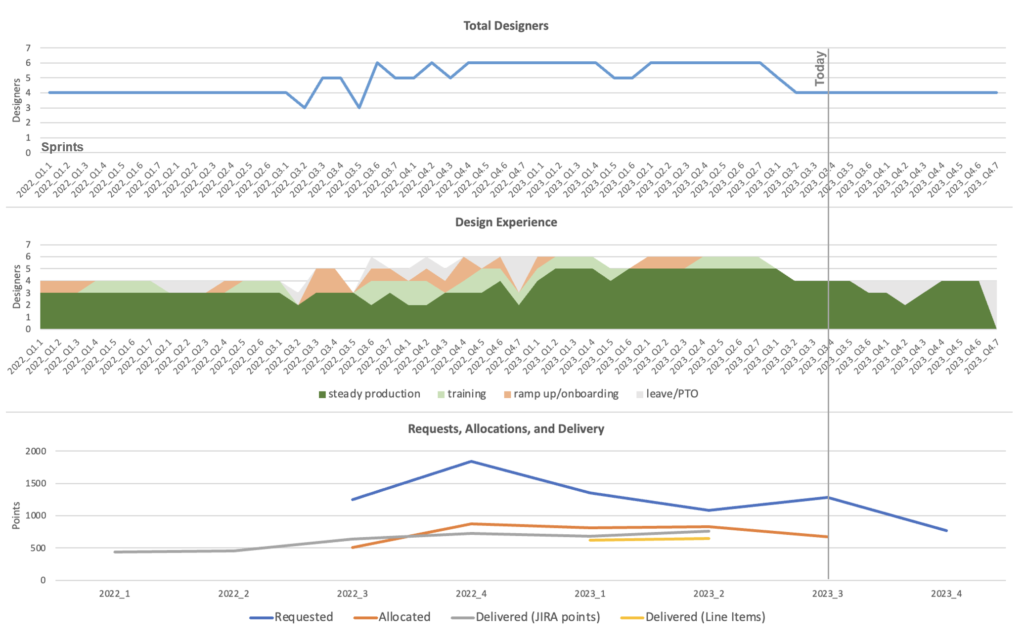
We were also calibrating our product request process over the same period. At the beginning, I regularly received requests for 3 times more designers than I had on my team (the blue line in the bottom chart, above), but when you compared to requirement preparation we found that the demand was neither as real nor as urgent as it sounded. Over time, most teams have calibrated to a more realistic sense of what they can accomplish within a given release cycle, and the gap between request and delivery has come down a bit.
The gap between request and allocation granted also opens up some useful conversations around resourcing, prioritization and tradeoffs between management and the product teams: if we ask for double what you’re able to provide, maybe resourcing is part of why we’re not moving as fast as you’d like. The point is not to force a particular conversation or discussion, but to inform ongoing recalibration to make sure that our execution is in line with company strategy. I compile and create reports twice quarterly so that we have a constant pulse on the org. Because design work is usually starting about 3-6 months before development, this gives us time to change course if needed for a particular product or release.
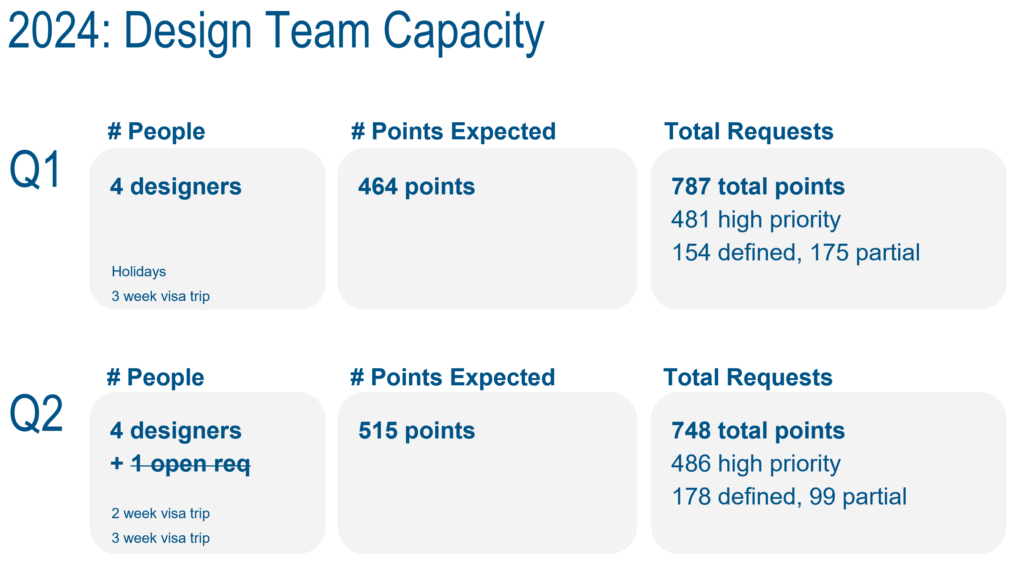
Based on just the line item collection and the allocations spreadsheet, we get a pretty good overview of what a quarter will look like going in.
Once a quarter is in progress, I don’t fuss too much about changes in plan; the allocation process is intended to ensure reasonable distribution of resources across the team, not to hold anyone to their roadmap. This frees the product teams up to reprioritize or rescope based on their realistic allocations, and for us to record the impacts of the prioritization choices that leadership made.
I do track any new items added during the quarter, and whether the items that are requested are completed or deprioritized at the end of the quarter, so that we have an informed perspective on requirements churn within the team. I compare the number of points estimated at the beginning of the quarter to the number tracked and delivered in JIRA per product; in some cases, a “small” request consumes much more than the anticipated resources, and in others it turns out to be much smaller than it sounded in the pitch. Observing these trends over time helps the team to understand and account for the “personality” of different product teams, and we can reflect that understanding in our allocation plan.
The chart below is one of my favorite summaries, because it reflects the “personalities” of different teams. In this particular quarter, design was allocated fairly high, and many products were allocated less than their requested amount. We delivered more items than requested for design, which means that some items were added in-quarter, but our JIRA points were actually below both request and allocation. This either means that we overestimated our work, or that we trimmed scope to reduce budget and support product work (in this case, it was the latter).
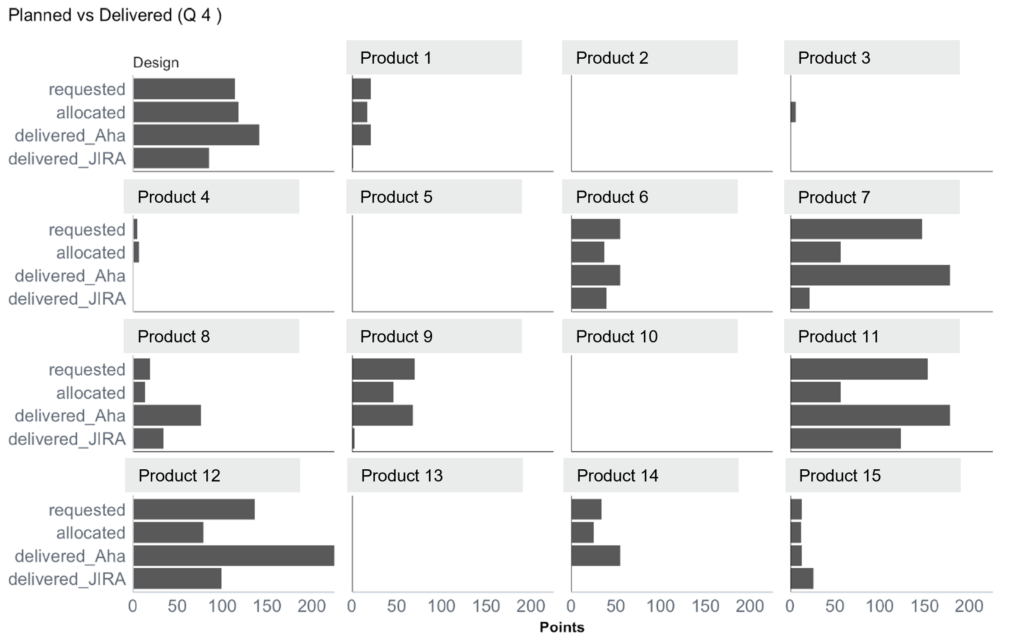
We had 3 products with major work requests (7, 11, and 12), and some with smaller items (4, 6, 8, 9). Product 4 ended up not delivering anything, and products 7, 9, and 11 delivered all or more than their requested items with almost no actual JIRA points at all. This indicates that their design requests (in Aha) were significantly overestimated. Products 7 and 11 are working with a new designer who hasn’t calibrated to their request style yet, and they tend to overstate both the complexity and scope of what they need to deliver. In this case, this designer spent a lot fewer points on product 7 than on product 11, and so that additional time went into product 11. I also had a conversation with the designer about estimation, so that we could tune for more accurate work assessment next quarter. Product 6 and 15 are two of our most dependable: they make conservative requests, we allocate what they ask for, and we deliver on budget because we have enough information to make a good estimate up front.
For designers, it’s often helpful to realize patterns in how they estimate or understand work coming from individual product teams. Some teams can make adding a button seem like launching a space program, while others casually mention that they plan to research and launch a massive feature like it’s no big deal. Sometimes affirming these differences in measurable ways helps designers understand how to react to requests from different partners and teams. If someone consistently overestimates the time required for their design work, this also shows up, and can be the starting point for a conversation about work efficiency and meeting team workload expectations.
These metrics do take some time to calculate and track, but once established, the process to calculate them is more tedious than onerous. I believe that the value they contribute far outweighs the effort. Having a clearly defined, traceable metric neutralizes most of the rancor in a product-vs-design debate over just who exactly is slowing things down.
A standard process with regular accountability checkpoints reinforces the cyclical roadmap and requirement definition cycle, gives the team a sense of common expectations and standards, and it empowers designers to say no to work that arrives late, half-defined, or outside of the design window. We still do most of the work that comes at us (and I have the data to prove it), but we also have a tool that helps us to pause and evaluate before reacting to whatever timeline panic is coming our way. It’s also a time for product to realize the consequences of late requirements: the engineering team might not have work to keep them busy, because designers need time to do their work, too.
I like to call this process our “thin bubble of protection.” Like the Earth’s atmosphere, it isn’t much in the grand scheme of things and it is pretty fragile, but sometimes that thin bubble is all you really need to thrive.